Bitcoin Trend Analysis Today

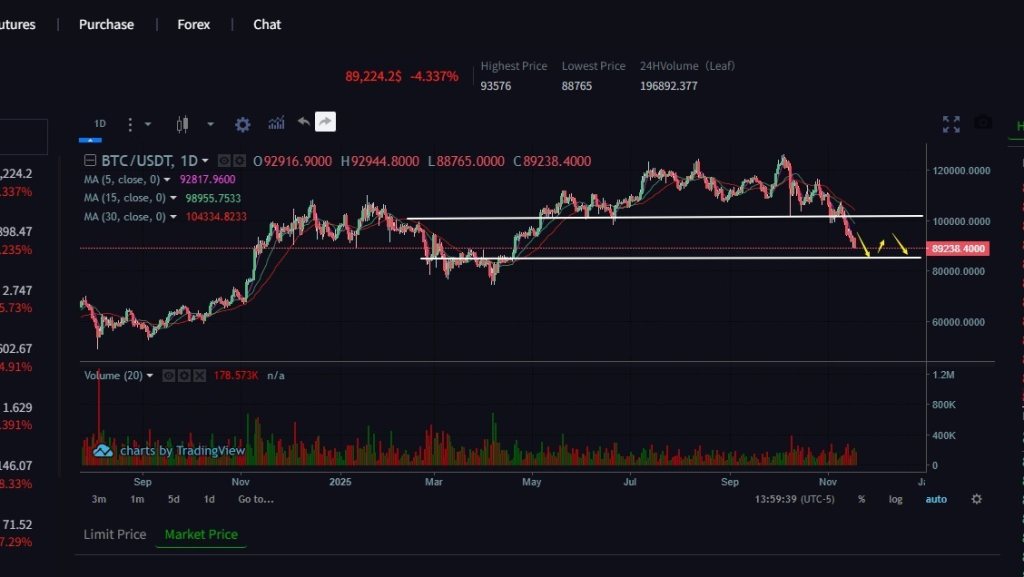
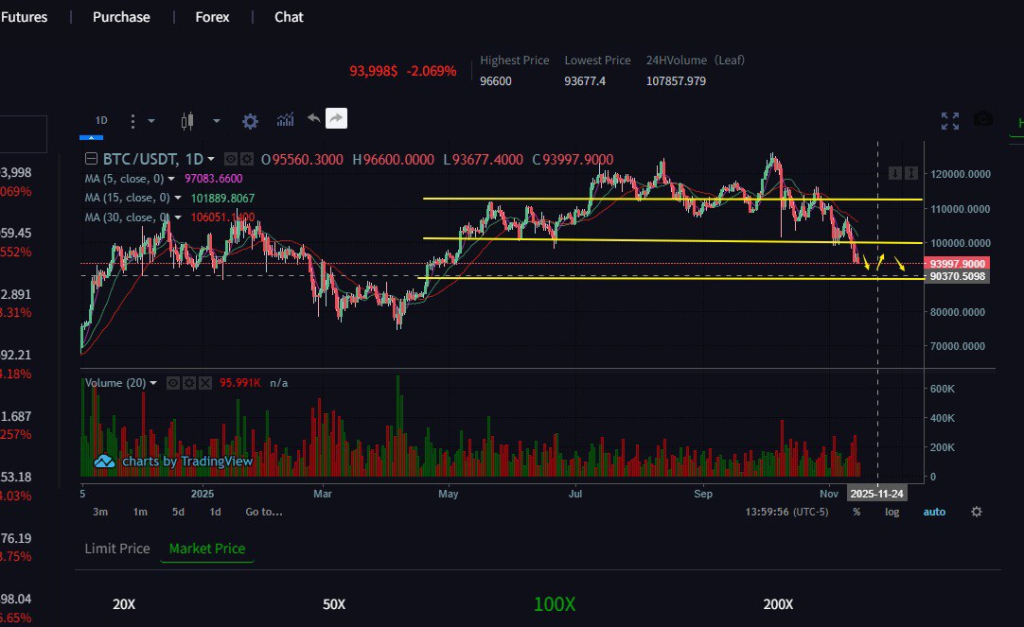
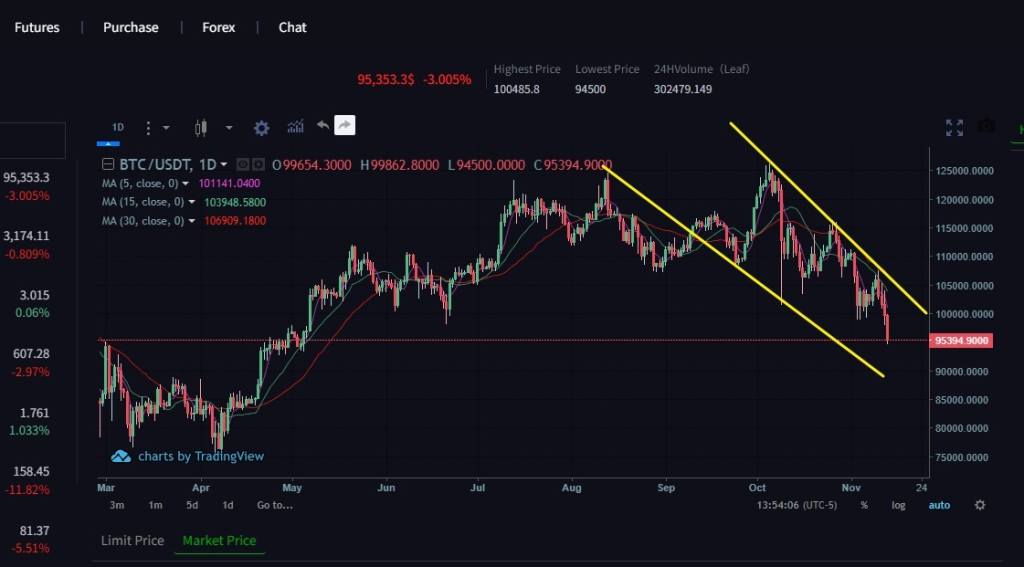
From a technical perspective, the current daily chart shows a continuous price decline, forming a series of bearish candlesticks, indicating an overall weak trend. On the hourly chart, the price has been consolidating after a pullback from its highs, with the current candlestick pattern within a relatively narrow trading range and no clear reversal signal. The hourly MACD indicator shows both the DIF and DEA lines are negative and trending downwards, with the MACD histogram showing expanding green bars, indicating that bearish forces are dominant. The hourly EMA (7, 30, and 120 moving averages) are in a bearish alignment, with the price trading below the EMA7, suggesting a downward trend. The daily EMA also shows a bearish alignment, further confirming the overall weakness. Therefore, the recommended strategy remains to sell on rallies.

Bitcoin Trend Analysis Today

Daily Chart: The price has fallen for three consecutive days, with all Bollinger Bands trending downwards. The KDJ indicator has formed a death cross and continues to diverge downwards. The MACD indicator has confirmed a second death cross, indicating a strong downtrend. As mentioned yesterday, a further pullback to lower levels was expected, and last night’s price action confirmed this prediction.

4-Hour Chart: The market has also fallen for three consecutive days, with concentrated downward momentum. The Bollinger Bands are widening, and the current downtrend remains firm. Notably, the price did not break below the lower band after touching it, instead showing signs of stabilization. Intraday short-term trading is recommended, buying on dips

Bitcoin Trend Analysis Today

Bitcoin is currently priced around $98,400, having broken below the $100,000 mark. The MACD histogram shows a renewed increase in red bars, and the DIF and DEA lines failed to converge intraday, forming a downward divergence again. This marks the second unsuccessful convergence after a death cross, indicating relatively strong bearish momentum. The KDJ lines are converging and diverging downwards, approaching oversold territory. The RSI lines are above 30 and continuing downwards. I believe the downside potential is not yet exhausted, and the strategy remains to sell on rallies.

The Bitcoin crash has caused significant losses for those investing in spot trading, but it has no impact on our futures trading. This is because we can short Bitcoin when the market is bearish, which is one of the advantages of futures trading. So far, all the Bitcoin signals I’ve shared have been correct.

Bitcoin Trend Analysis Today

The daily chart for BTC shows a recent continuous price decline, forming a long bearish candlestick. It touched a low of 101,300 on November 12th, indicating overall weakness. The hourly chart saw a rapid drop on the morning of November 12th, with the candlestick body shrinking, suggesting a potential short-term bottom. The hourly MACD indicator is below the zero line, with both DIF and DEA values ​​negative. The MACD histogram has gradually narrowed after several periods of increasing volume, indicating weakening bearish momentum. The hourly EMAs (7, 30, and 120 moving averages) are in a bearish alignment. The EMA7 is close to the current price, indicating significant short-term resistance; the EMA30 and EMA120 are far from the price, suggesting continued medium-term weakness. In the short term, watch the strength of the support level around 100,000.

Bitcoin Trend Analysis Today

Bitcoin is currently in a short-term rebound phase, with the MACD golden cross and Bollinger Band middle line providing positive support, but the KDJ overbought condition poses a risk of volatility. In the medium term, a breakout above the 107708-109759 range could confirm a reversal, targeting 112000-114000. Initial support is at 103000, with strong support at 99000; resistance lies in the 108000-110000 range. Overall, Bitcoin has entered a rebound phase after the sharp drop, with bullish momentum recovering, but the medium-term trend has not completely reversed. Short-term trading is recommended to buy low and sell high while controlling position size, waiting for a breakout with significant volume to confirm the trend.

Bitcoin Trend Analysis Today
📊

The daily chart shows a recent continuous price decline, with yesterday’s large bearish candle indicating strong bearish momentum. The hourly chart shows a small bullish rebound, but the overall trend remains downward, failing to break the previous high near 108300. The hourly MACD histogram is negative and shortening, with the fast and slow lines below the zero line, indicating weakening bearish momentum but not yet a trend reversal. The hourly RSI has rebounded from oversold territory (21.77) to 37.70, suggesting some short-term correction, but remains weak. The hourly EMA7 and EMA30 are both above the current price, showing a bearish alignment and significant resistance; the EMA120 is far from the current price, indicating a continued downward trend in the short term. The recommended strategy is to sell on rallies, with the next support level to watch being the 100,000 psychological level.

Bitcoin Trend Analysis Today

From a technical perspective, BTC has been in a downtrend recently on the daily chart, forming consecutive bearish candles and showing a clear downward trend. The MACD indicator on the hourly chart shows both the DIF and DEA lines negative and diverging downwards, indicating increasing bearish momentum; the daily chart also shows bears in control, but with signs of weakening. The hourly RSI is 27.72, entering oversold territory, suggesting a potential short-term rebound; the daily RSI is 36.09, approaching oversold territory, indicating continued weakness overall. The 7, 30, and 120-period moving averages on the hourly chart are in a bearish alignment, and the current price is below all moving averages, indicating continued pressure in the short term. On the daily chart, the price is also below major moving averages, confirming the downtrend; short-term trading should focus on shorting.

Bitcoin trend analysis

Bitcoin is currently trading around 114,800. The intraday market has surged again, directly breaking through the 4-hour MA200, MA240, MA280, and MA80 lines. While the price has retreated, it has rebounded again, supported by these four lines. There is still room for further upside, and it remains to be seen whether it can break through the previous high. A closing pattern has formed within the 1H BOLL channel, with the upper limit below yesterday’s high near 116,000. However, the MACD red bar has contracted, so it is recommended not to rush into shorting! If the second test is successful, the next resistance level will be above 117,200, followed by the daily upper limit at 120,000. If buying, pay attention to the J value in the KDJ indicator, which has reached overbought territory