
Bitcoin Trend Analysis Today
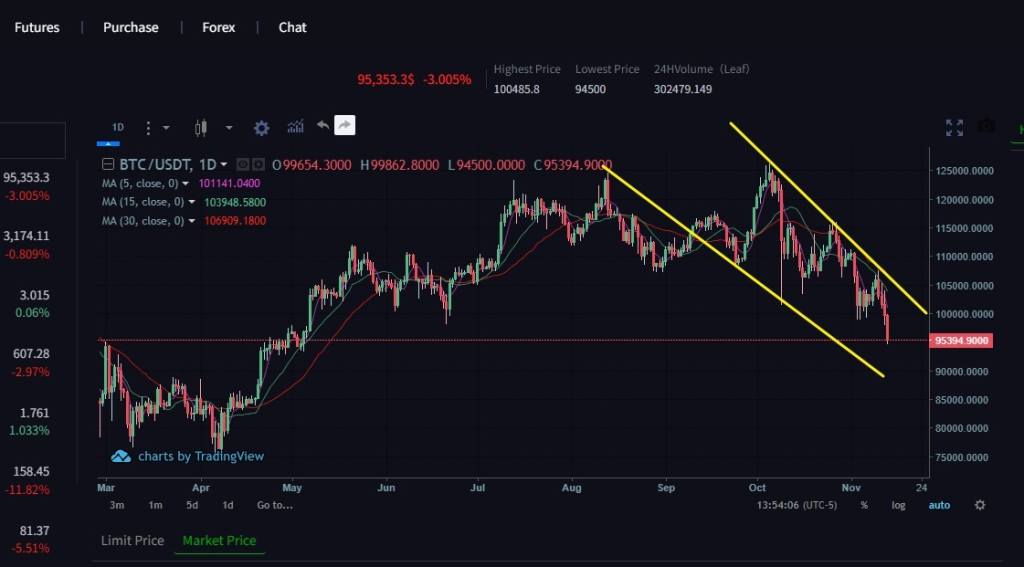
Daily Chart: The price has fallen for three consecutive days, with all Bollinger Bands trending downwards. The KDJ indicator has formed a death cross and continues to diverge downwards. The MACD indicator has confirmed a second death cross, indicating a strong downtrend. As mentioned yesterday, a further pullback to lower levels was expected, and last night’s price action confirmed this prediction.
4-Hour Chart: The market has also fallen for three consecutive days, with concentrated downward momentum. The Bollinger Bands are widening, and the current downtrend remains firm. Notably, the price did not break below the lower band after touching it, instead showing signs of stabilization. Intraday short-term trading is recommended, buying on dips