
Bitcoin Trend Analysis Today
From a technical perspective, the daily chart for BTC shows significant recent price volatility. Yesterday’s candlestick was a bullish candle with a long lower shadow, indicating buying support below. The MACD indicator on the hourly chart shows the DIF line gradually converging towards the DEA line, with the appearance of red histogram bars, indicating strengthening bullish momentum in the short term. However, it’s still necessary to closely monitor whether this momentum can sustain and break through resistance levels. On the hourly exponential moving average chart, the 7-period exponential moving average has crossed above the 30-period exponential moving average, but it’s still far from the 120-period exponential moving average, indicating that the trend has not yet fully reversed and further confirmation from the bulls is needed.
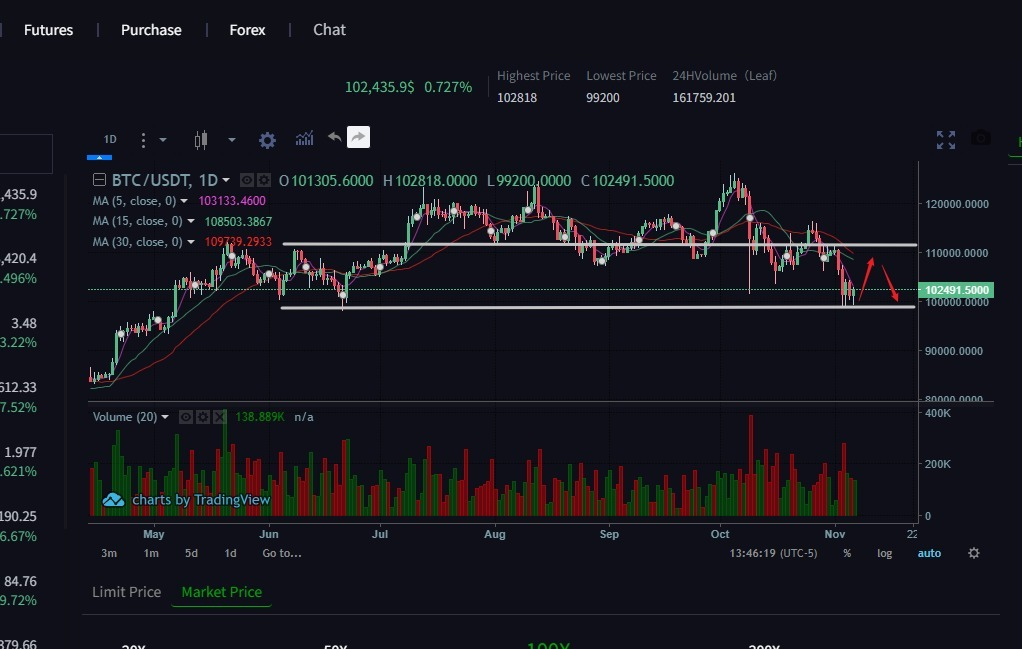
Today’s BTC short-term trading strategy: Short at 103500-102500; Long at 99800-100600