
Bitcoin Trend Analysis Today
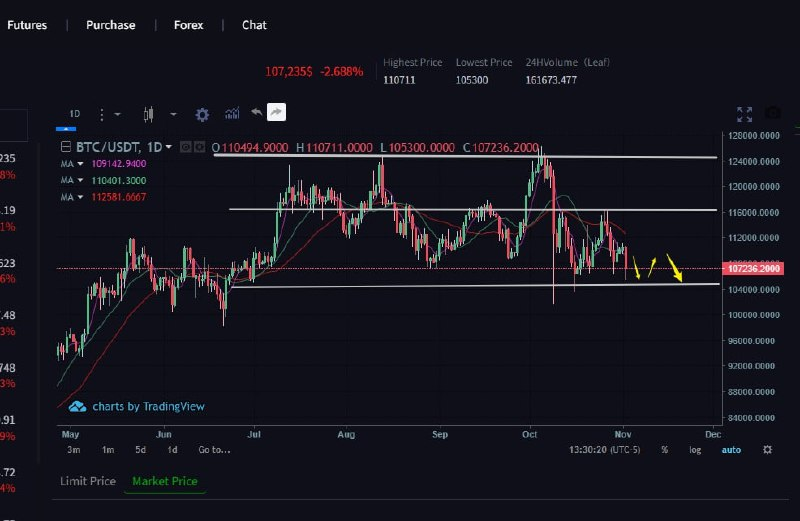

The daily chart shows a recent continuous price decline, with yesterday’s large bearish candle indicating strong bearish momentum. The hourly chart shows a small bullish rebound, but the overall trend remains downward, failing to break the previous high near 108300. The hourly MACD histogram is negative and shortening, with the fast and slow lines below the zero line, indicating weakening bearish momentum but not yet a trend reversal. The hourly RSI has rebounded from oversold territory (21.77) to 37.70, suggesting some short-term correction, but remains weak. The hourly EMA7 and EMA30 are both above the current price, showing a bearish alignment and significant resistance; the EMA120 is far from the current price, indicating a continued downward trend in the short term. The recommended strategy is to sell on rallies, with the next support level to watch being the 100,000 psychological level.