The effort is starting small, but Texas made an opening foray into a state-based crypto reserve — getting closer to the first government stockpile in the U.S.
It’s not technically the start of a direct state-based bitcoin reserve, but Texas has picked up $5 million in a bitcoin ETF, which a spokesman said is a placeholder for the first direct state-funds investment.
The state is working on its reserve, having put out an information request that expired last month, and it had already appropriated $10 million earlier this year for that purpose.
Other states have previously put state pension funds into such ETFs on behalf of retirees, but advocates are still awaiting a state to start its own stockpile.
HP Inc said on Tuesday it expects to cut between 4,000 and 6,000 jobs globally by fiscal 2028 as part of a plan to streamline operations and adopt artificial intelligence to speed up product development, improve customer satisfaction and boost productivity.
Dell forecast fourth-quarter revenue and profit above Wall Street estimates on Tuesday, as increasing investments in data centers to support artificial intelligence applications boost demand for its servers.
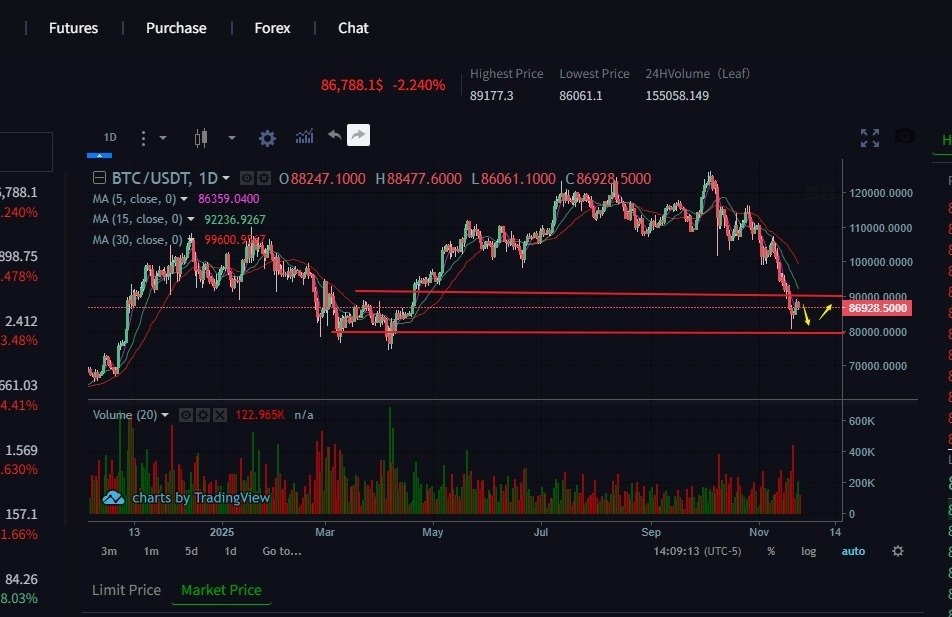
Bitcoin is currently priced at $86,900. The BTC market is currently in a state of uncertainty due to both technical factors and the external environment. Key support is around $80,600, and resistance is around $88,885. Moving averages are in a bearish alignment, but short-term momentum is weakening, and the moving averages are flattening, suggesting the market may be entering a period of observation. On the daily chart, bulls and bears are battling, with the price fluctuating and falling back near the highs. The MACD indicator on the 2-hour chart shows that bears dominate in the short term; however, the uptrend on the daily chart has not been completely broken. Currently, the market may fluctuate within a range, and the recommended strategy is to short at higher levels and long at lower levels
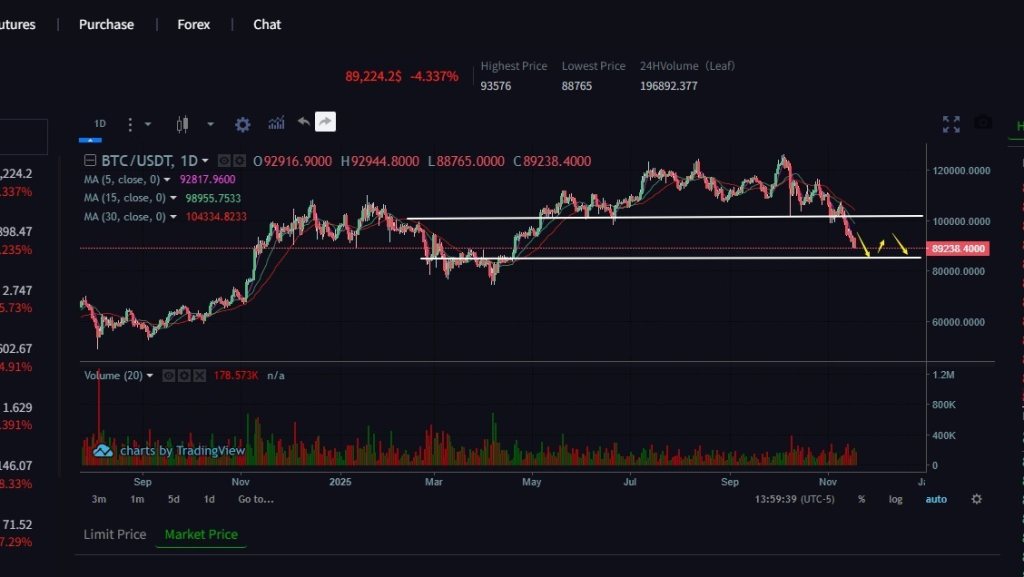
Bitcoin is currently priced at 88,700, exhibiting low-volatility range-bound trading. While trend indicators still show a bearish alignment, short-term candlestick patterns have formed a bullish engulfing pattern, creating potential bullish resonance. The price level near the Bollinger Band’s middle line further indicates a relatively balanced market sentiment, making a clear breakout unlikely in the short term. Strong buying support exists at the daily chart’s lows. The 2-hour candlestick shows a small bullish candle, indicating short-term bullish dominance. The 2-hour MACD bullish signal is strengthening; the daily chart remains in a weak recovery phase, with the EMA providing effective short-term support, and the overall trend leaning towards bullish. Currently, the market is at two extremes: a short-term overall bullish trend and a long-term overall bearish trend. The recommended strategy is to primarily short on rallies, following the larger trend.
The DeFi Education Fund estimated that decentralized finance technology could potentially save people up to $30 billion annually by reducing remittance costs.
The DeFi Education Fund, an advocacy organization focused on decentralized finance, has proposed utilizing the technology to reduce costs, aiming to address poverty in the United States and globally.
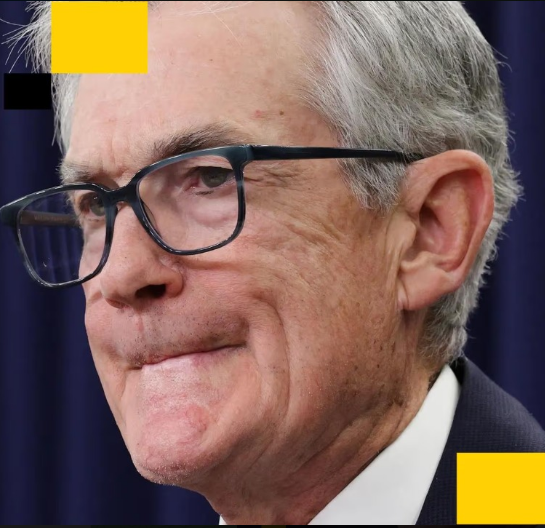
Traders slash chances of a December cut to 33% as the Fed loses a key data point ahead of its final 2025 meeting.
The BLS said that the October employment report will scrapped due to the government shutdown and the November jobs numbers won’t be released until after the Fed’s December meeting.
The odds of a December Fed rate cut — nearly 100% as recently as three weeks ago — tumbled further to just 33%.
U.S. stocks gave up large early gains and crypto prices fell further as the news hit.
Daily chart: The decline is smooth; although there have been rebounds, they are weak. Indicators are all in a death cross and show no signs of turning back, indicating further downside potential.
4-hour chart: After a series of rebounds, three consecutive bearish candles have appeared, indicating significantly insufficient bullish momentum. The key resistance level above has not been effectively broken. The RSI has turned from flat to a death cross, and the overall pattern remains bearish. Intraday short-term trading is recommended to focus on selling on rallies.