
Bitcoin Trend Analysis Today
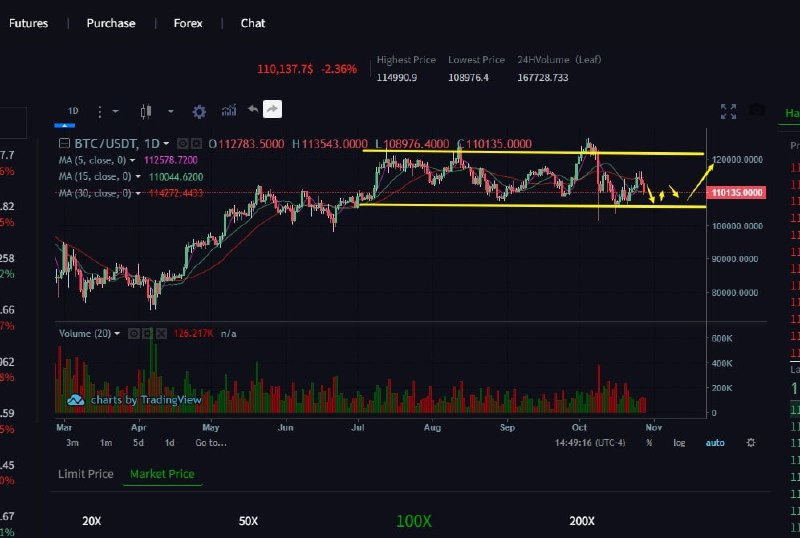
From a technical perspective, BTC has been in a downtrend recently on the daily chart, forming consecutive bearish candles and showing a clear downward trend. The MACD indicator on the hourly chart shows both the DIF and DEA lines negative and diverging downwards, indicating increasing bearish momentum; the daily chart also shows bears in control, but with signs of weakening. The hourly RSI is 27.72, entering oversold territory, suggesting a potential short-term rebound; the daily RSI is 36.09, approaching oversold territory, indicating continued weakness overall. The 7, 30, and 120-period moving averages on the hourly chart are in a bearish alignment, and the current price is below all moving averages, indicating continued pressure in the short term. On the daily chart, the price is also below major moving averages, confirming the downtrend; short-term trading should focus on shorting.