
Bitcoin Trend Analysis Today
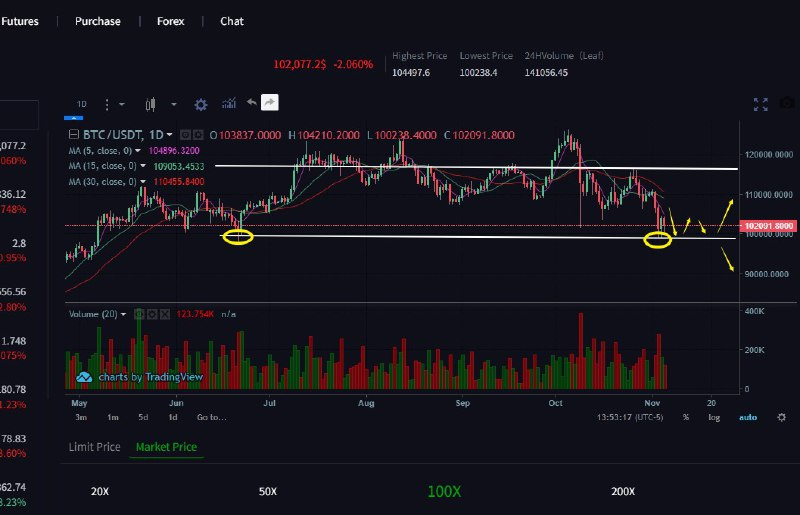
From a short-term technical perspective, the daily chart for BTC shows a continued price decline, with yesterday’s long bearish candlestick. The hourly chart shows a sideways trend with gradually rising lows, but the overall trend remains weak. In the hourly MACD indicator, both the DIF and DEA are negative, and the MACD histogram is green, indicating that bears are in control; however, there are signs of decreasing volume in the short term, suggesting a possible consolidation phase. The hourly RSI is at 38.15, nearing oversold territory, indicating a potential for a rebound, but the strength is limited. The hourly EMA (7-period moving average < 30-period < 120-period moving averages) are in a bearish alignment, with the price clearly suppressed by the EMA7, indicating a continued bearish short-term trend

Today’s short-term trading strategy:
Short at 102800-102000
Long at 99000-100000